CARBON FOOTPRINT & FRENCH PV TENDERS – Impact of the manufacturing country and process: what are the optimization targets?
This article is part of the Carbon Footprint series:
- Rapid introduction to the CRE bidding mechanism
- Introduction to Simplified Carbon Footprint: calculation
- LCA and optimized carbon values: method 2 & documentary process
- Impact of the manufacturing country and process: what are the optimization targets?
- Low carbon supply: The Norwegian question
- Low carbon modules: what are the promising alternatives
- Is Polysilicon FBR a solution for the French market?
Step-by-Step impact assessment https://www.synapsun.com/en/introduction-to-simplified-carbon-footprint-calculation/
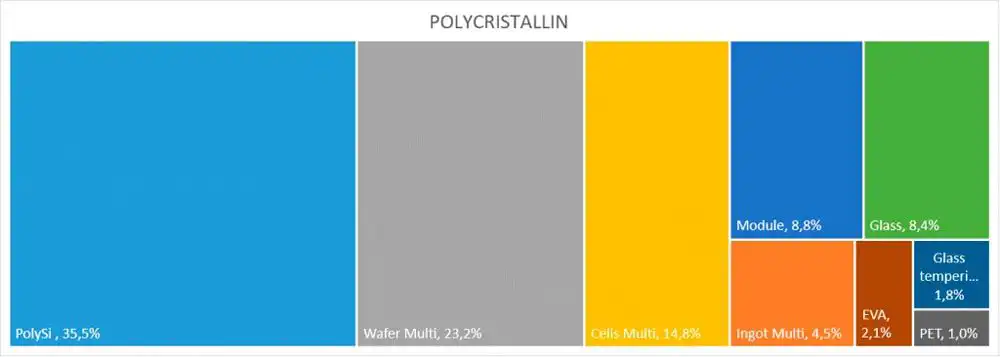
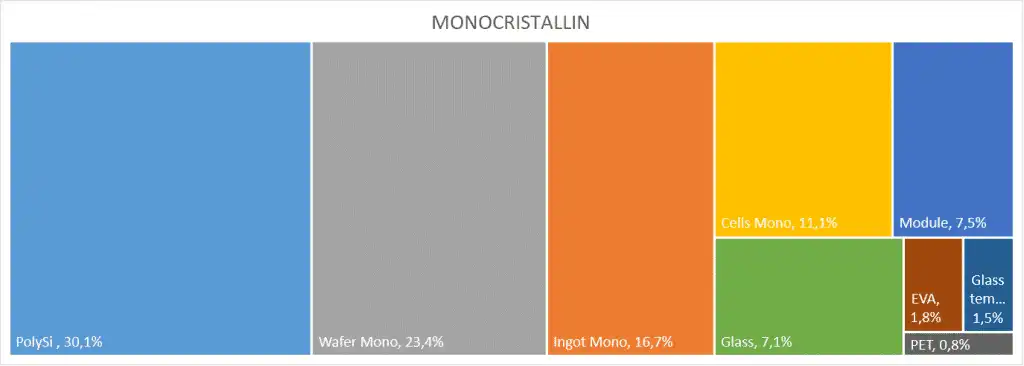
Before performing any Life Cycle Analysis, it is useful to analyze the weight of the carbon impact of each manufacturing step and component. Referring to Figure 1 below, we quickly realize that purification of polysilicon and wafers sawing account for more than half of the final value for either polycrystalline or monocrystalline technology (when using “World” standard GWP values specification). Worth noting also, is the ingots casting step, which is much more impacting for mono technology.
As mentioned above, two criteria can be used to optimize the final value: the manufacturing origin or site, and the realization of a LCA that can enhance an energy-saving process. Be careful however, every LCA performed does not always result in an optimization of the carbon impact; sometimes the result obtained is not significantly better, if not worse, than the standard values. We could mention the PERC cells, for example, which require more energy than the standard cells in their manufacture.
Importance of the production origins
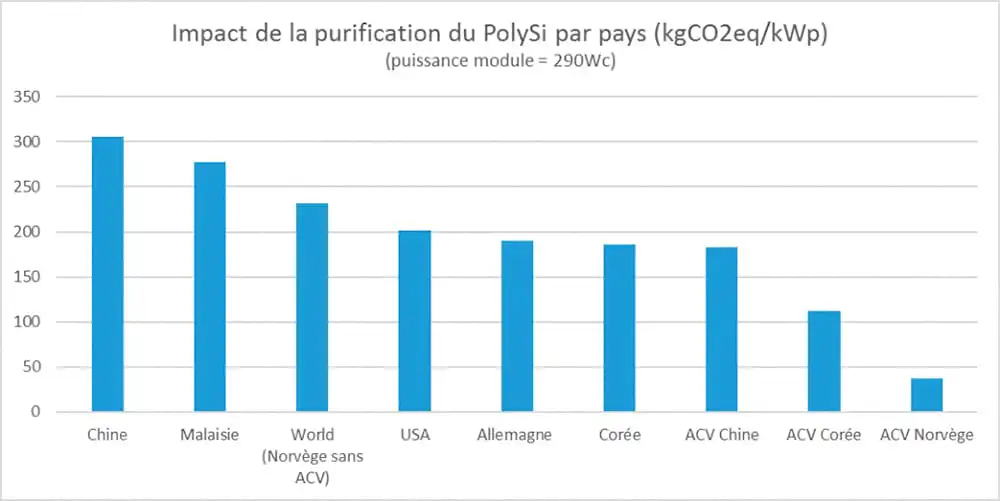
The first way to reduce the carbon impact is to optimize the origin of its supply. The cell and module manufacturers have understood this, and as soon as the CRE3, they have turned to the Norwegian suppliers, who produce polysilicon and/or ingots by using a favorable electric mix, which is mainly made up of hydraulic energy. These suppliers quickly realized LCAs on the Polysilicon part, because Norway’s standard GWP coefficient for this step is not included in the specification table (if method 1 requires the use of the “World” penalty coefficient). Below are some representative values:
The Norwegian sector has thus been able to rely on the French CRE AOs in order to revive itself, by restarting factories*. However, their production capacity often appears insufficient to meet the demand. We will discuss this in Chapter 5.
Optimization by manufacturing process
In addition to the manufacturing country, significant “carbon” savings can be achieved by identifying and performing LCAs among manufacturers, through the use of innovative processes that require less energy and raw materials. These innovations or optimizations are industrialized essentially by economic interest, but at the same time participates in the reduction of the carbon impact of the PV sector.
Let’s consider some of these processes that are making the headlines in the PV industry:
Diamond Wire Sawing for wafers
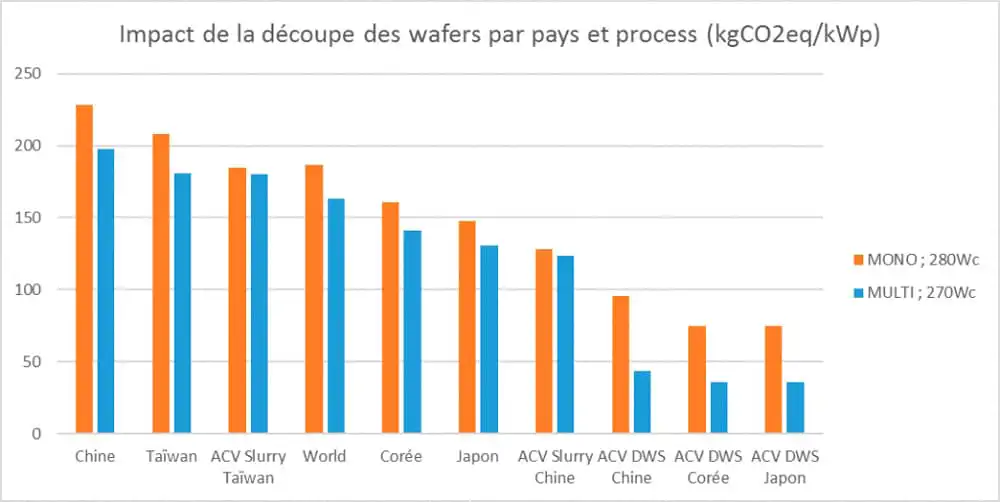
Diamond Wire Sawing (DWS) reduces cutting time and produces more wafers than conventional slurry sawing. It is widely used today for monocrystalline, though still very less industrialized for the polycrystalline. It enables an important carbon reduction of this production stage: about 80%, compared to the conventional sawing for monocrystalline and 60% for polycrystalline technology (see Fig. 3).
The use of recycled polysilicon in ingots
The recycling of waste from ingots and wafers sawing is fairly widespread in the PV industry, for economic reasons. After recycling, this polysilicon can be reused to cast new ingots. However, the recycled polysilicon is not as pure as the original one, so it should be used in certain proportions. Commonly, it is limited to 70% for a monocrystalline ingot and 40-50% for a polycrystalline. This reduces the final impact even further, because the recycled polysilicon that has been subjected to a LCA will have a minimal carbon footprint.
Fluidized Bed Reactor, for the purification of polysilicon
The purification of polysilicon by the FBR (Fluidized Bed Reactor) method, which uses much less energy than the standard method, also results in a considerable carbon gain (up to -50%). Although less expensive, this method is still very less used. It’s thus a process to be closely watched…
We can also mention the constant increase in the size of the ingots, the reduction in the thickness of the wafers, the reduction of the amount of silver for the screen-printing of the cells’ contacts… More broadly, an internal policy of optimized consumption of raw materials and the reduction of losses will have a positive effect. The same holds true for the age of the machine fleet; generally, the new manufacturing tools consume less, so these lines are prioritized for LCA.
What are the priority targets for optimization?
The accumulated experience in the analysis of the carbon impact of each stage of manufacturing has allowed us to prioritize optimization leads, and thus the investment in LCA. The following chart summarizes the standard (Method 1) and optimized (Method 2) Carbon Emissions values, and allows us to make the following findings:
- LCA essential for the Polysilicon and Wafer parts
- Strong impact of the Monocrystalline ingot part; LCA to be performed
- Little interest in the realization of LCAs for the cell and module parts
In addition to that, the use of the low-carbon processes described above will enable an even more interesting optimization.
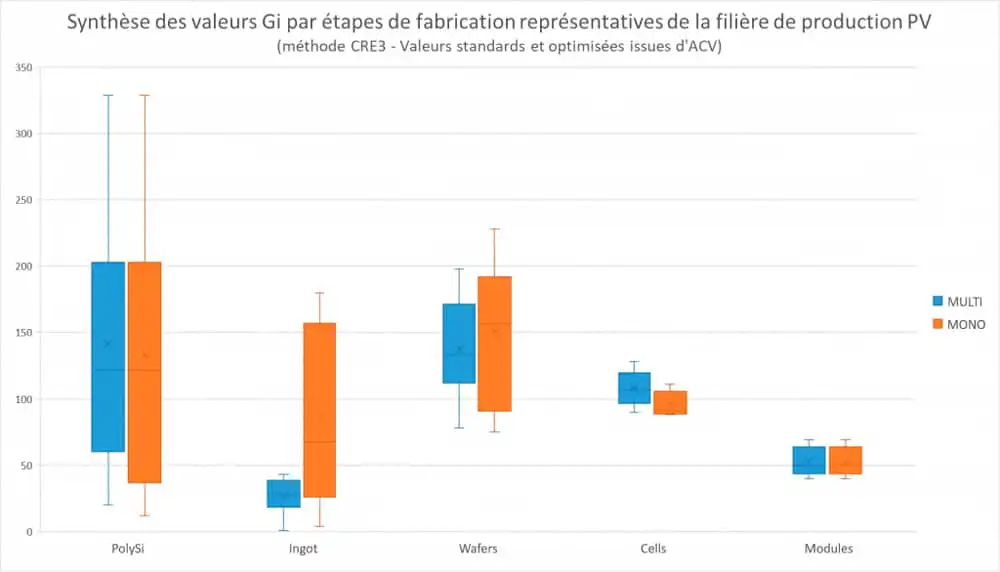
The values from Norwegian Polysilicon and Ingots are also included in this graph. In Chapter 5, we shall discuss the stakes of this supply.
* 02/2016 ELKEM announces the production of 5000 tons of ingots per year, by restarting sections of the old REC factories in Herøya. Source: https://www.tu.no/artikler/na-skjer-det-elkem-starter-nytt-soleventyr-pa-heroya/277211